 The DSO is certainly the most widely used indicator in credit management in all countries of the world.
 It is a major stake because of its key role in evaluating business performance and its effect on the working capital requirement (WCR).
However, it is not easy to grasp. It is the subject of discussions the more passionate and discordant that the speakers are experts in credit management. Interpretation of the results of the Days Sales Outstanding can be a nightmare.
A not so obvious definition
Many people think that the DSO is the average payment time of customers, probably because it is an easy explanation to give and to understand. This is wrong.Indeed, it is calculated with open receivables, that is to say invoices not yet paid by customers. How can we deduce an average delay of payment then?
*the recognition of revenue is not necessarily linked to the billing but in some cases to the advancement of costs (IFRS rules on projects management).
From an accounting point of view, it is called the receivable rotation period.
Like any current asset, the accounts receivables are transitory accounts.
An item (invoice...) created in one of these accounts is not expected to persist but to be cleared after a reasonable time. Otherwise, a doubt arises regarding the collectability of the debt with as a consequence the need to take a provision.
Several calculation methods which do not facilitate its interpretation
It is possible to identify two main calculation methods: the balance sheet method and the roll back method of exhaustion of the receivables by the sales. There are in addition a multitude of variances on data considered by companies to calculate it.
The same method applied in two different companies give different results just because the first one deduct the provisions for bad debts or provisions made for credits to be issued (trade discounts, year-end bonuses ... etc.) from the receivable, which directly influences the result.
In addition, two calculation methods produce different results because they do not have the same sensitivity to the monthly changes in turnover.
How to interpret the results
Many credit managers regularly ask themselves one of these questions:
- Why the result rose 3 days this month?
- How to explain a sudden improvement (ie reduction)?
For example, the balance sheet method calculated over 3 months of turnover is very responsive to sales changes. A big month of turnover just realized improves the indicator but will deteriorate in a few months, when it comes out of the calculation when all the debt it has generated has not yet been cleared.
For example, if the receivable has fallen by 50 000 but the turnover last month decreased by 80 000, the DSO will increase.
To better understand the DSO, it is necessary to decline it into parts, for example by current DSO (corresponding to unmatured invoices) and DSO overdue (resulting from the delay of payment of invoices).
It is possible to split it for each type of data that are present in the accounts receivable.
Example of split with the contractual and overdue parts
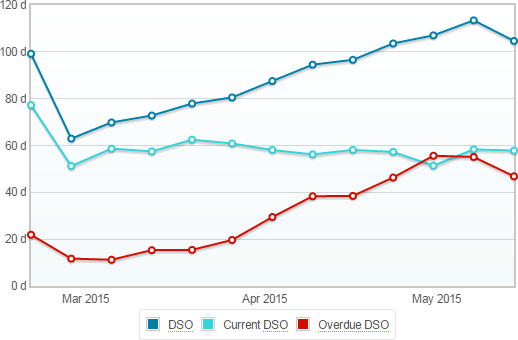
This breakdown allows to better understand the results and explain the reasons of the changes of the indicator.
How to improve it?
The best ways to sustainably improve the DSO are simpler than its daily interpretation. This is to get better payment terms with its customers and to apply them:- Get more downpayments.
- Decrease the payment terms granted to customers.
- Secure the receivable to avoid overdue and unpaid invoices.
- Manage well risks on projects and business cases.
- Improve collection processes.
- Manage well and quickly the disputes...
Conclusion
The DSO is an imperfect indicator of performance. It can be coupled with other indicators (overdue rate, unpaid rate ... etc.) to evaluate the performance of a business in accounts receivable management.With a volatile nature, it must be interpreted on an average of at least several months and do not get excited or tense because of a sudden change.
However, it is essential that it is calculated and followed whatever is the size of the company because it allows to quickly identify a drift of customers' payment behavior and / or of payment terms granted to them.
It is also the main component of working capital requirement, and therefore deserves all the attention of business leaders and managers.
See our tutorial on the DSO and the online calculation tool.